Example 5 — Indirect Response Model
Model: 1-compartment IV PK + indirect-response simulation, fitted with a direct Emax approximation
Script: examples/05_indirect_response.py
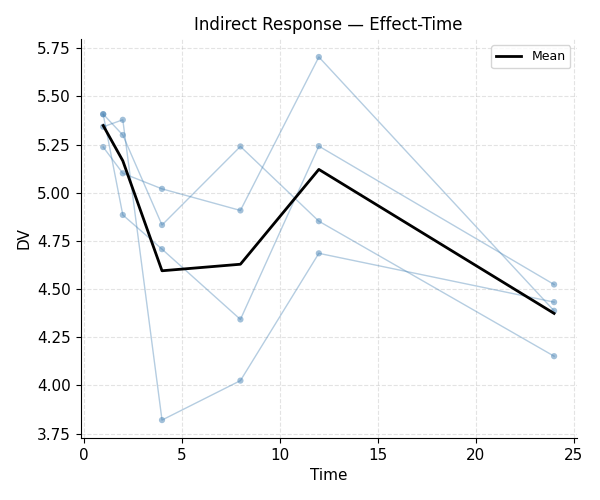
This example simulates an indirect response model with scipy.integrate, then
fits the resulting observations with a simplified direct Emax approximation in
$ERROR.
Pharmacodynamic model
The simulation uses an inhibitory turnover model:
dR/dt = Kin * (1 - IMAX * C / (IC50 + C)) - Kout * R
where C is the PK driving function (ADVAN1 central compartment).
Because the example simulates the turnover system externally, the fitted model
uses a pragmatic direct-effect approximation inside $ERROR rather than a
full turnover ODE during estimation.
Key concepts
# Approximate direct-effect fit used during estimation

.error("""
    E0    = THETA(3)
    EMAX  = THETA(4)
    EC50  = THETA(5)
    W     = THETA(6)
    IPRED = E0 + EMAX * F / (EC50 + F)
    Y     = IPRED + W * EPS(1)
    IRES  = DV - IPRED
    IWRES = IRES / W
""")
Output
openpkpd/estimation/fo.py:114: UserWarning: ETA1 shrinkage is 100.0% (>30%). EBE-based analyses for this parameter may be unreliable.
  res.compute_shrinkage()
openpkpd/estimation/fo.py:114: UserWarning: ETA2 shrinkage is 100.0% (>30%). EBE-based analyses for this parameter may be unreliable.
  res.compute_shrinkage()
Simulating indirect response data...
Fitting...
Method: FO
OFV: 29.3839
AIC: 49.3839
BIC: inf   (n_obs = 0)
n_parameters: 10
Converged: True
THETA: [1.00000001e-02 1.89489807e+01 4.00000000e+00 3.00000000e+00
 5.00000000e+00 5.00000000e-01]
OMEGA (diagonal): [1.11529688e-06 1.08522839e-07]
SIGMA (diagonal): [0.19917258]
ETA shrinkage: ['100.0%', '100.0%']
Shrinkage warnings:
  ETA1 shrinkage is 100.0% (>30%). EBE-based analyses for this parameter may be unreliable.
  ETA2 shrinkage is 100.0% (>30%). EBE-based analyses for this parameter may be unreliable.
Figures
Notes
The example illustrates simulation of a turnover model and fitting with a simpler approximation, not a full turnover fit.
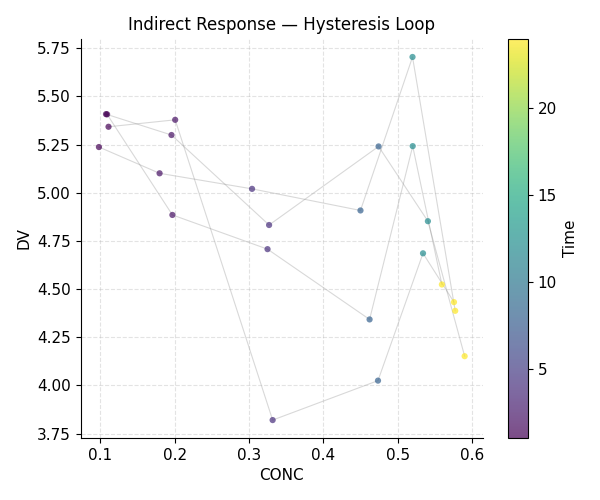
Counter-clockwise hysteresis in the C–E plot is a hallmark of indirect response models (effect lags concentration).
Clockwise hysteresis suggests tolerance, auto-induction, or distributional delay.