Example 7 — Full Diagnostic Plot Gallery
Script: examples/07_diagnostic_plots.py
A complete walkthrough of every diagnostic plot function using the theophylline FO model from Example 1 — Theophylline (FO).
Output
openpkpd/estimation/foce.py:236: UserWarning: ETA1 shrinkage is 72.5% (>30%). EBE-based analyses for this parameter may be unreliable.
  res.compute_shrinkage()
openpkpd/estimation/foce.py:236: UserWarning: ETA2 shrinkage is 73.6% (>30%). EBE-based analyses for this parameter may be unreliable.
  res.compute_shrinkage()
openpkpd/estimation/foce.py:236: UserWarning: ETA3 shrinkage is 82.3% (>30%). EBE-based analyses for this parameter may be unreliable.
  res.compute_shrinkage()
Running FOCE...
Method: FOCEI
OFV: 278.7017
AIC: 298.7017
BIC: inf   (n_obs = 0)
n_parameters: 10
Converged: False
THETA: [ 1.5   0.08 30.  ]
OMEGA (diagonal): [0.5 0.3 0.3]
SIGMA (diagonal): [0.1]
ETA shrinkage: ['72.5%', '73.6%', '82.3%']
Shrinkage warnings:
  ETA1 shrinkage is 72.5% (>30%). EBE-based analyses for this parameter may be unreliable.
  ETA2 shrinkage is 73.6% (>30%). EBE-based analyses for this parameter may be unreliable.
  ETA3 shrinkage is 82.3% (>30%). EBE-based analyses for this parameter may be unreliable.

Created 14 figures.
Figures saved to docs/_static/examples
Figures
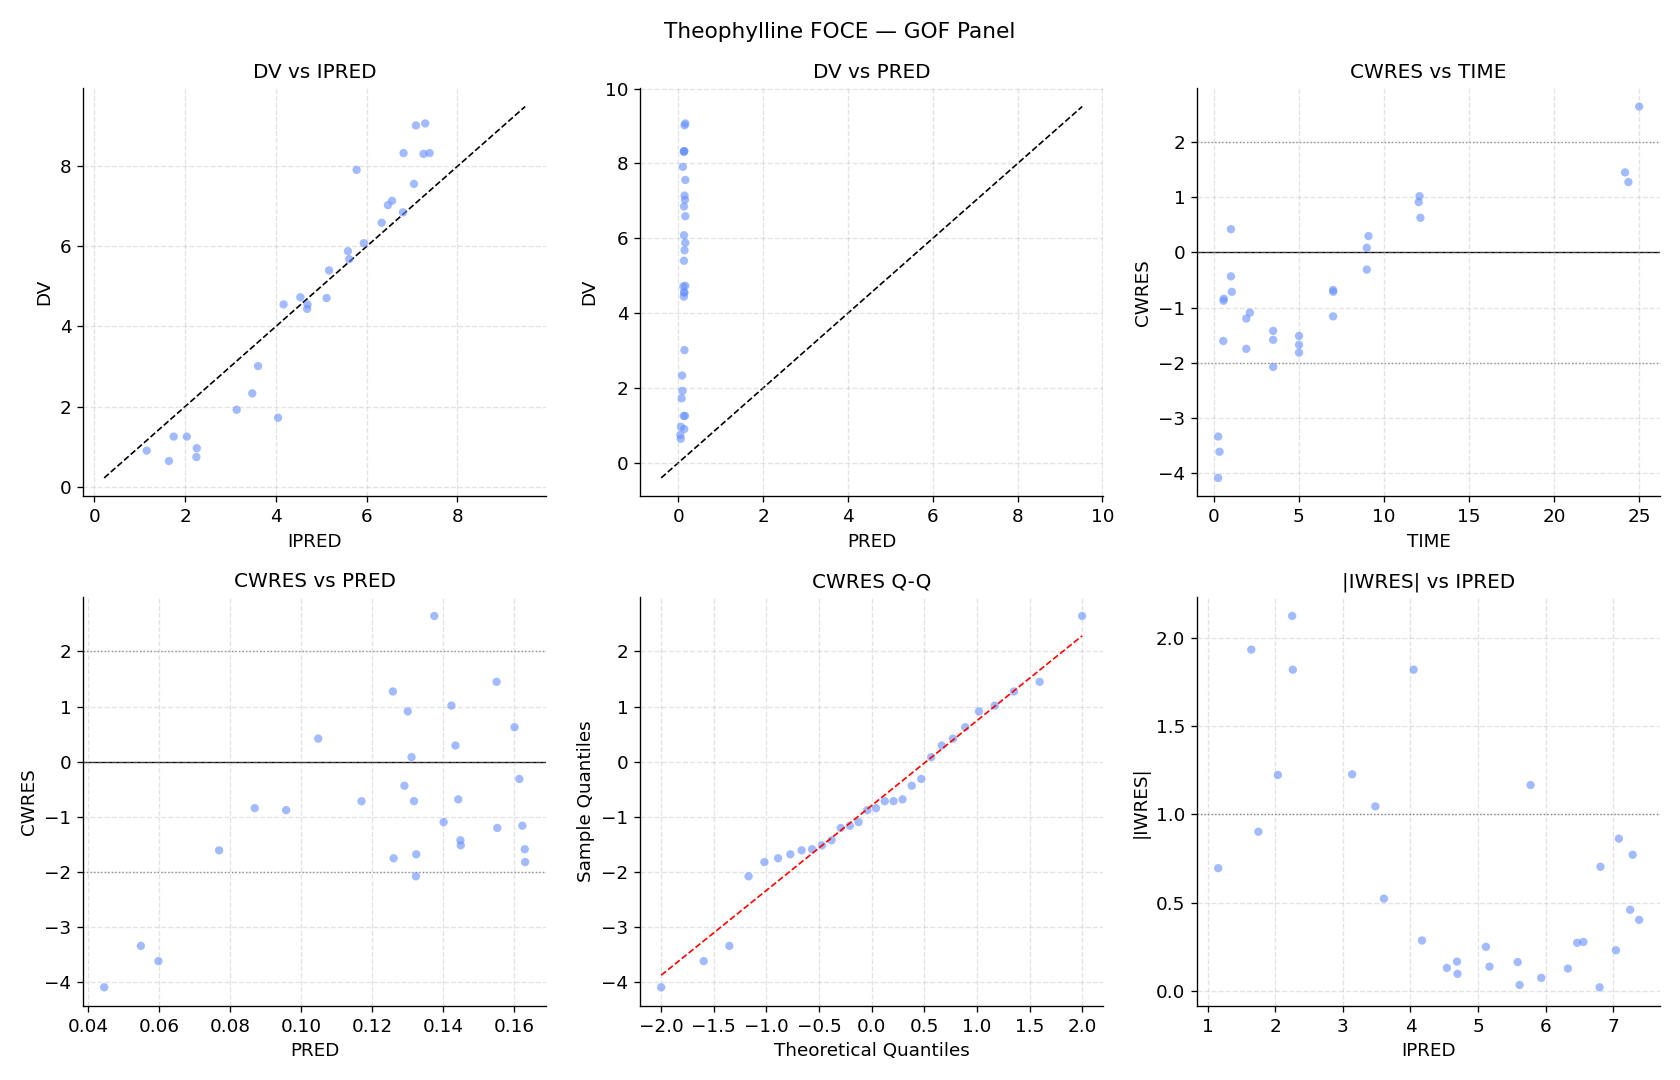
GOF panel (2×3 composite)
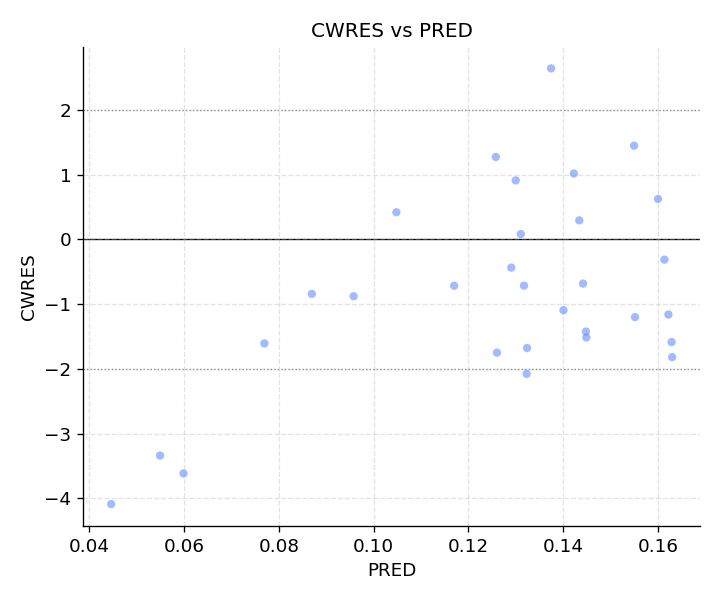
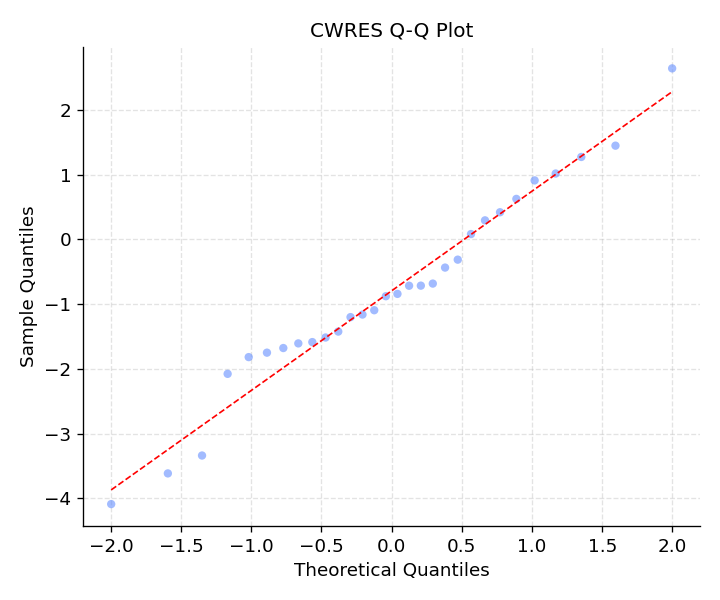
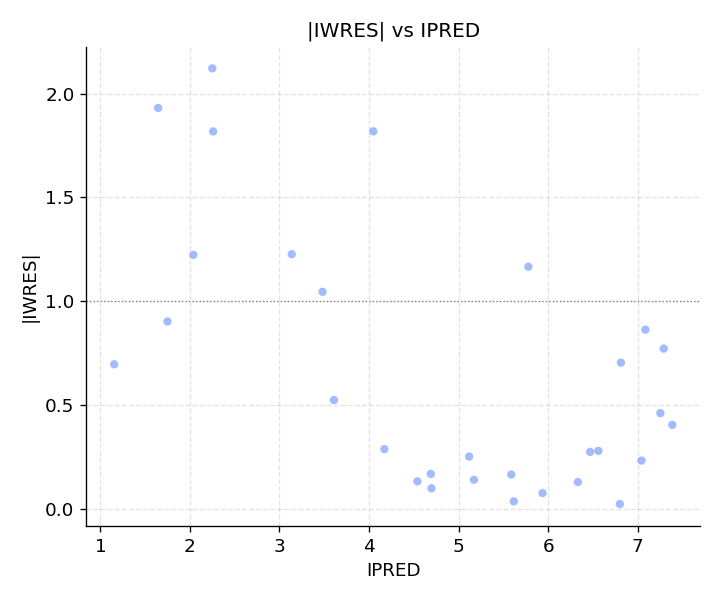
The panel contains DV vs IPRED, DV vs PRED, CWRES vs TIME, CWRES vs PRED, CWRES Q-Q, and |IWRES| vs IPRED.
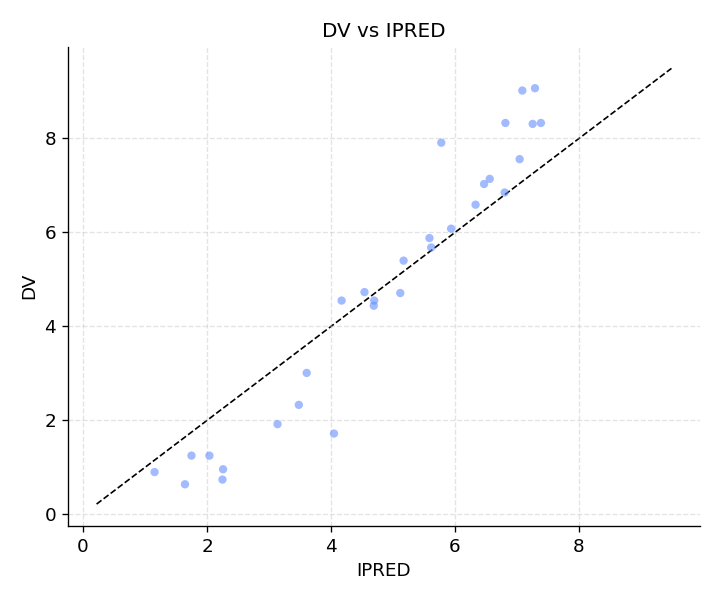
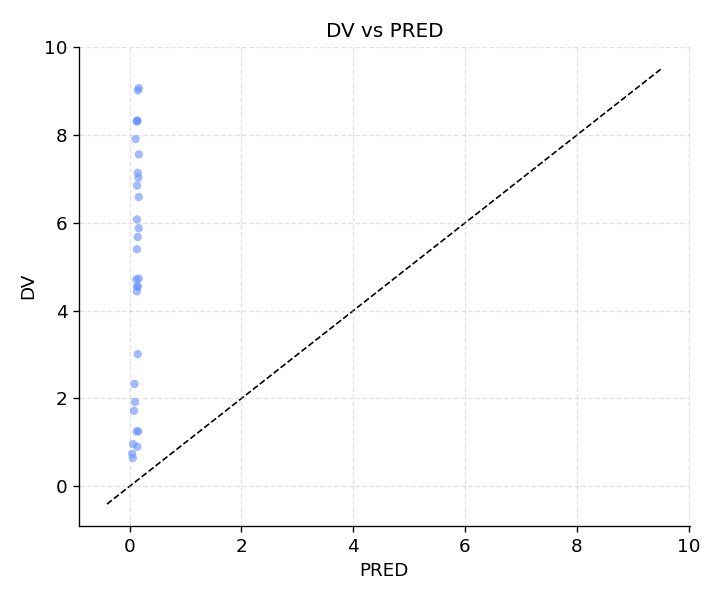
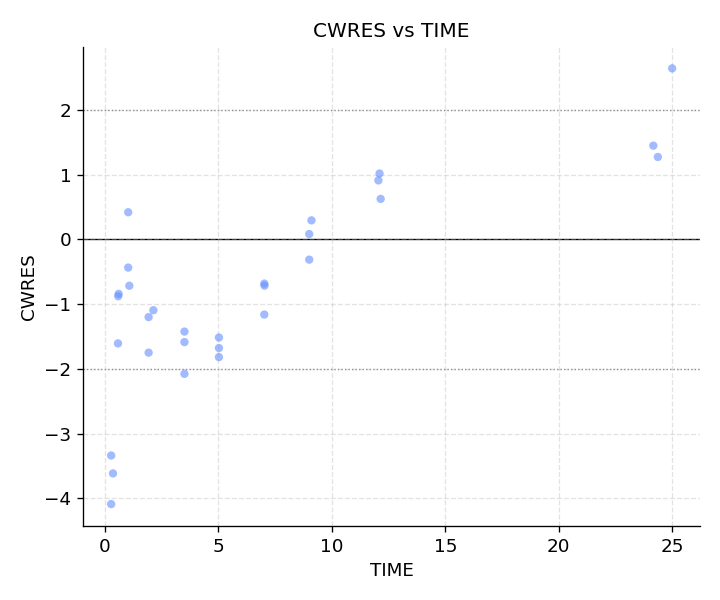
Individual GOF plots
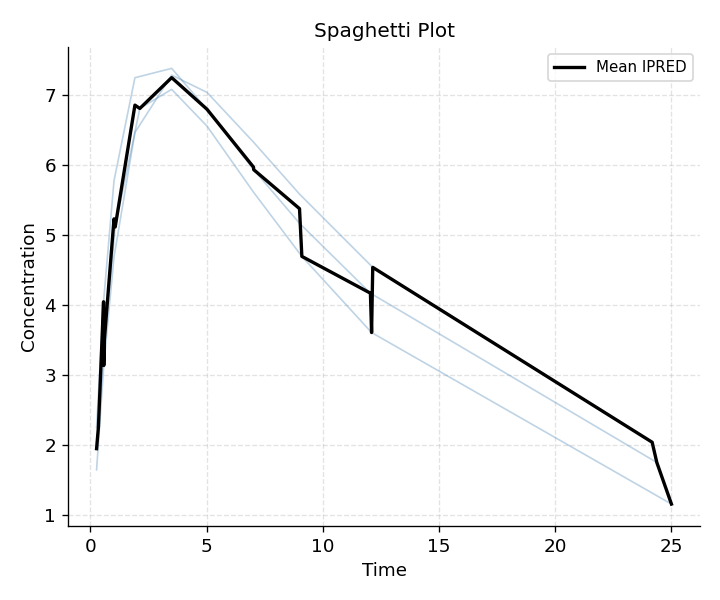
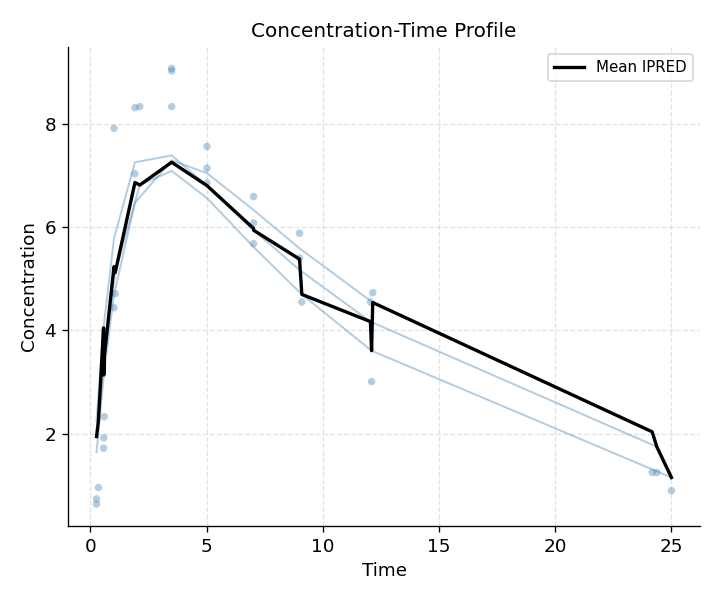
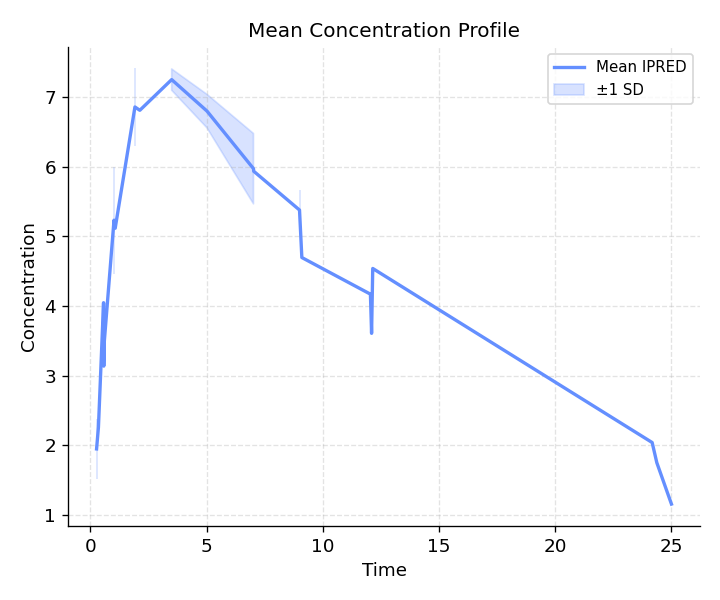
PK concentration-time plots
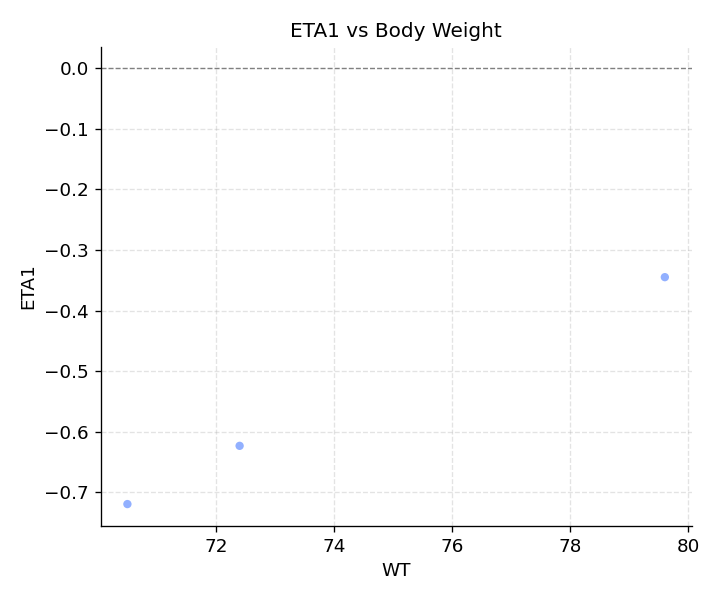
ETA diagnostics
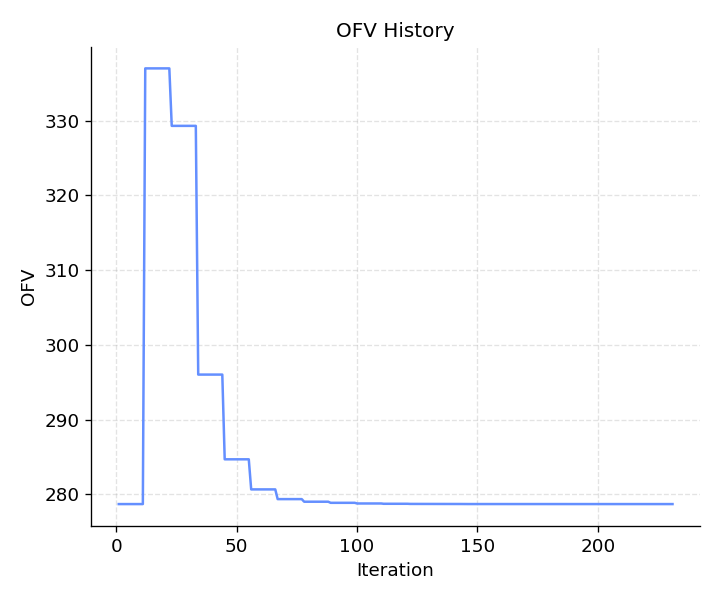
OFV convergence
Interpreting GOF plots
Plot |
What to look for |
|---|---|
DV vs IPRED / PRED |
Points close to the identity line, no systematic bias |
CWRES vs TIME |
Random scatter around zero; no trend or funnel |
CWRES vs PRED |
Random scatter; no heteroscedasticity |
CWRES Q-Q |
Points on the diagonal line; normality of residuals |
|IWRES| vs IPRED |
Homogeneous spread; no increasing trend (proportional error check) |
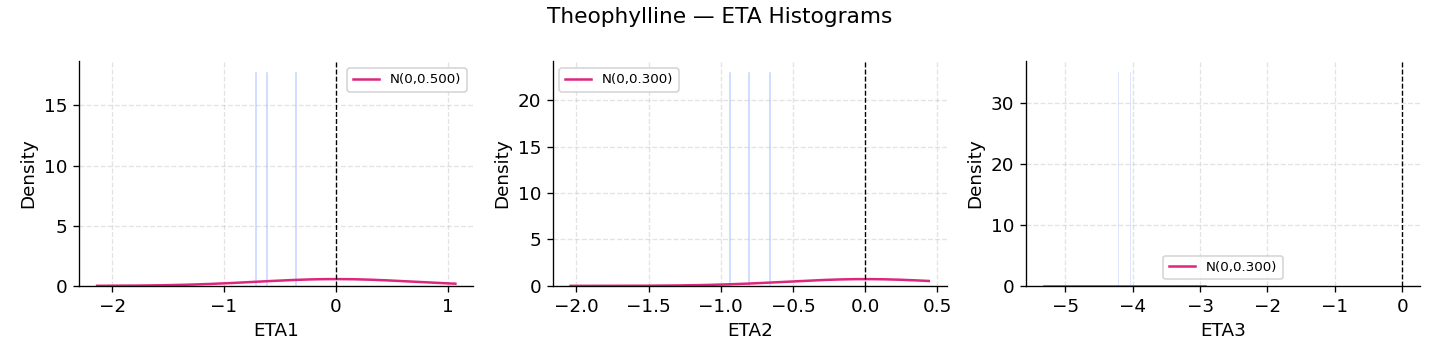
ETA histograms |
Symmetric, approximately normal distributions |
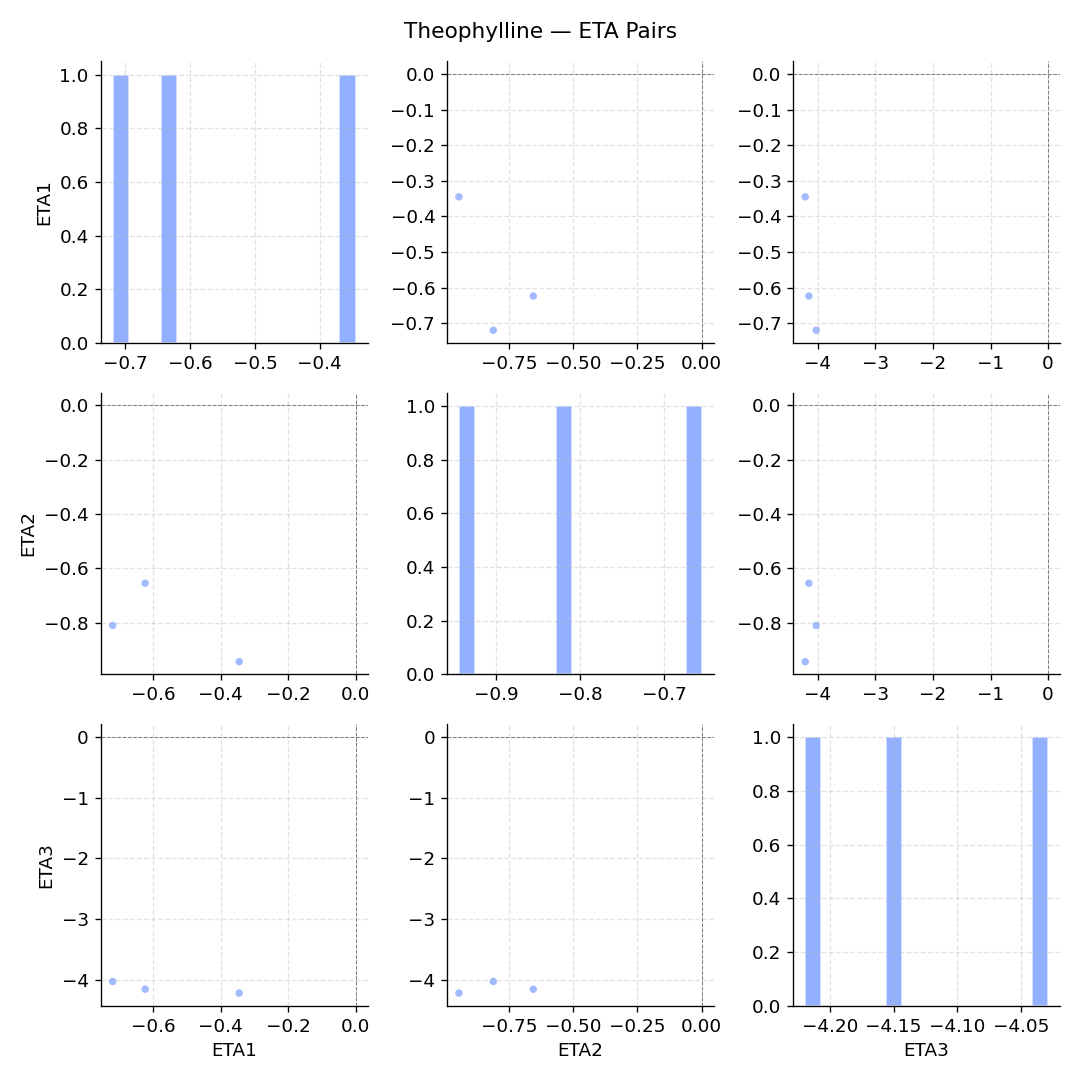
ETA pairs |
No strong correlations (would suggest OMEGA mis-specification) |
ETA vs covariates |
Flat relationship (no unexplained covariate effect) |